A data-mining study of 3,982 Airbnb listings from one metropolitan area, with two goals: understand what drives nightly price, and find natural market segments (budget, family, luxury).
Workflow
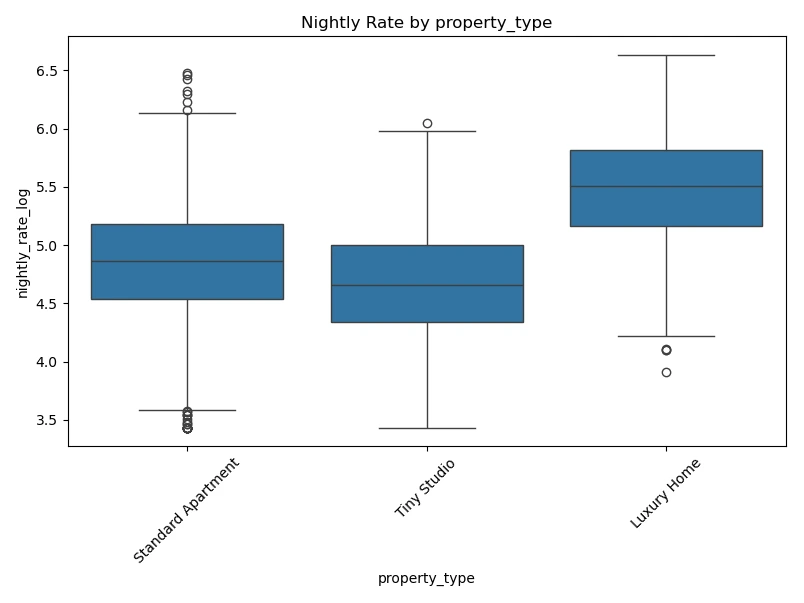
- Explore: distributions, outliers, and rates by property type, capacity and season.
- Test: ANOVA and t-tests on capacity, seasonality and cleaning fees.
- Model: linear regression vs. decision trees, compared on R² and MAE.
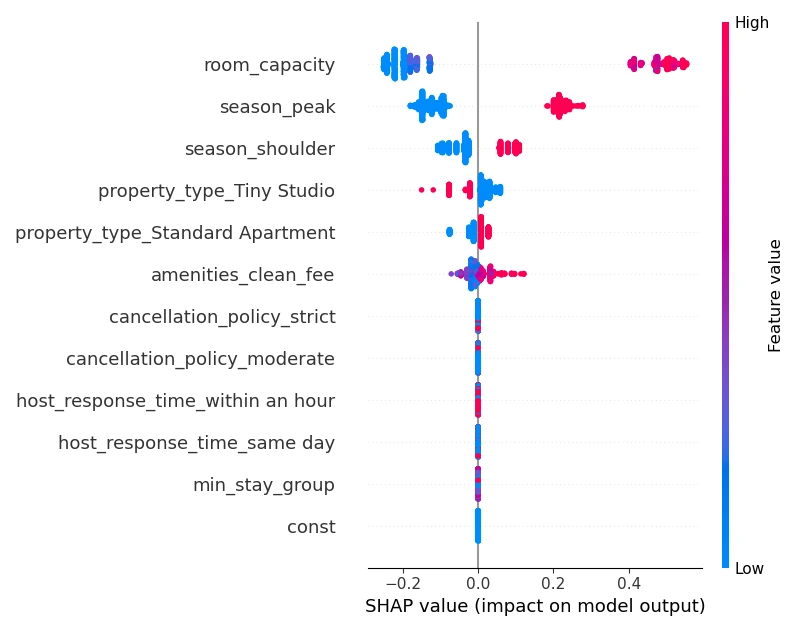
- Explain: SHAP and partial dependence plots for global and local effects.
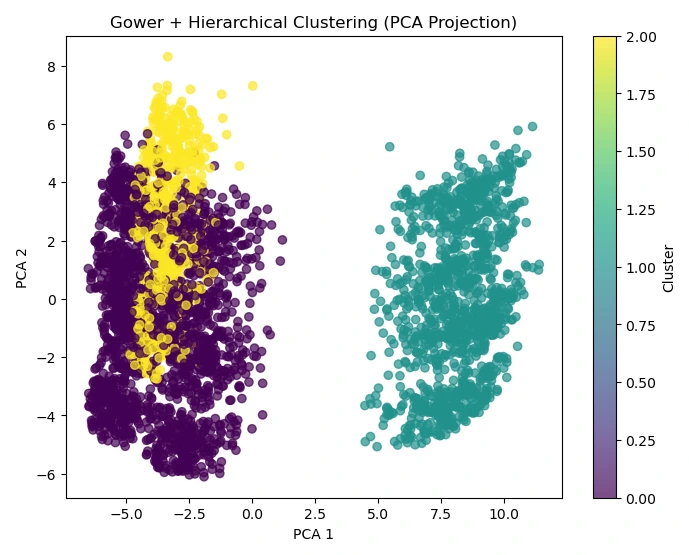
- Segment: Gower distance with agglomerative (hierarchical) clustering, projected with PCA, and each segment profiled.